Lexcube
About
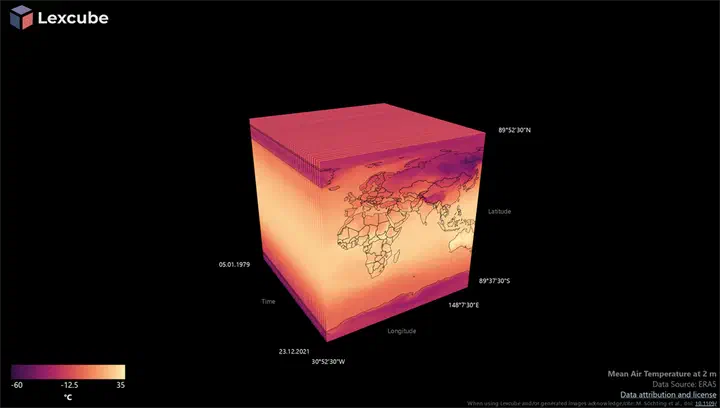
Lexcube, short for Leipzig Explorer of Earth Data Cubes, is a tool for the interactive visualization of large-scale Earth system data, developed at Leipzig University. Lexcube enables users to explore terabyte-scale remote sensing and modeling datasets in a three-dimensional data cube format, with space and time treated as equal dimensions. This approach allows for intuitive exploration and analysis of complex Earth system data, such as temperature changes or ecosystem dynamics, over time and space.
On Lexcube.org, users can browse a selection of datasets, e.g. the Earth System Data Cube or ECMWF data sets, using any device, including mobile phones and tablets. On touch-capable devices, touch controls can be used to intuitively interact with the data cube. Using the open-source Lexcube for Jupyter Notebooks package, users can interactively explore and visualize any of their own 3D data as 3D data cubes within their scientific computing environment. Both Lexcube.org and the package feature various export functionality, including printing a template to craft a paper version of the visualized data cube.
The project is funded by the European Space Agency (ESA), as part of the DeepESDL activity. It was initially funded by the National Research Data Infrastructure for Earth System Sciences NFDI4Earth (pilot projects).
Data
- Earth System Data Cube
- Spectral Indices from Sentinel-2 in Hainich, Germany (via Awesome Spectral Indices)
- ERA5 Specific Humidity
- CAMS global reanalysis (EAC4)
Publications
- M. Söchting, M. D. Mahecha, D. Montero and G. Scheuermann, “Lexcube: Interactive Visualization of Large Earth System Data Cubes,” in IEEE Computer Graphics and Applications, vol. 44, no. 1, pp. 25-37, Jan.-Feb. 2024, doi: 10.1109/MCG.2023.3321989.
Team
- Maximilian Söchting (Leipzig University, Germany)
- Gerik Scheuermann (Leipzig University, Germany)
- Miguel Mahecha (Leipzig University, Germany)